As an experienced trader, understanding and leveraging trend reversal signals has been pivotal to my success in the financial markets. Identifying these signals accurately allows traders to enter or exit positions at the most opportune times, maximizing profits and minimizing losses. In this comprehensive guide, I’ll share insights, strategies, and personal experiences to help you master trend reversal signals.
What Are Trend Reversal Signals?
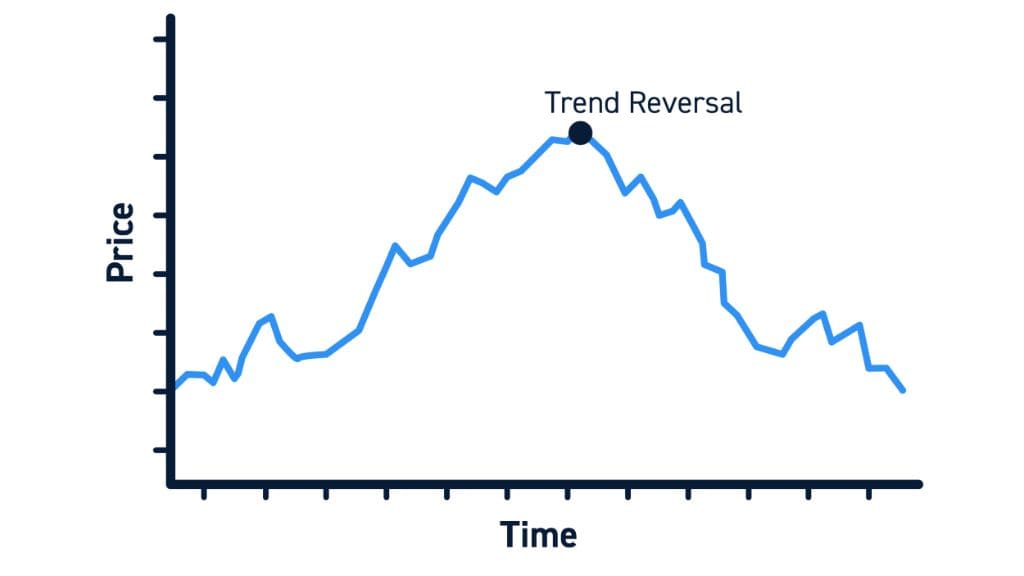
Trend reversal signals are indications that a prevailing market trend is about to change direction. Recognizing these signals is crucial for traders as they provide valuable opportunities to capitalize on new market trends or exit positions before the market turns against them.
Importance of Identifying Trend Reversals
In the dynamic world of trading, markets constantly fluctuate. Being able to identify when a trend is reversing gives traders an edge, allowing for strategic decision-making that can lead to significant profits or prevent substantial losses.
Key Chart Patterns Signaling Trend Reversals
Head and Shoulders Chart Pattern
What Is It?
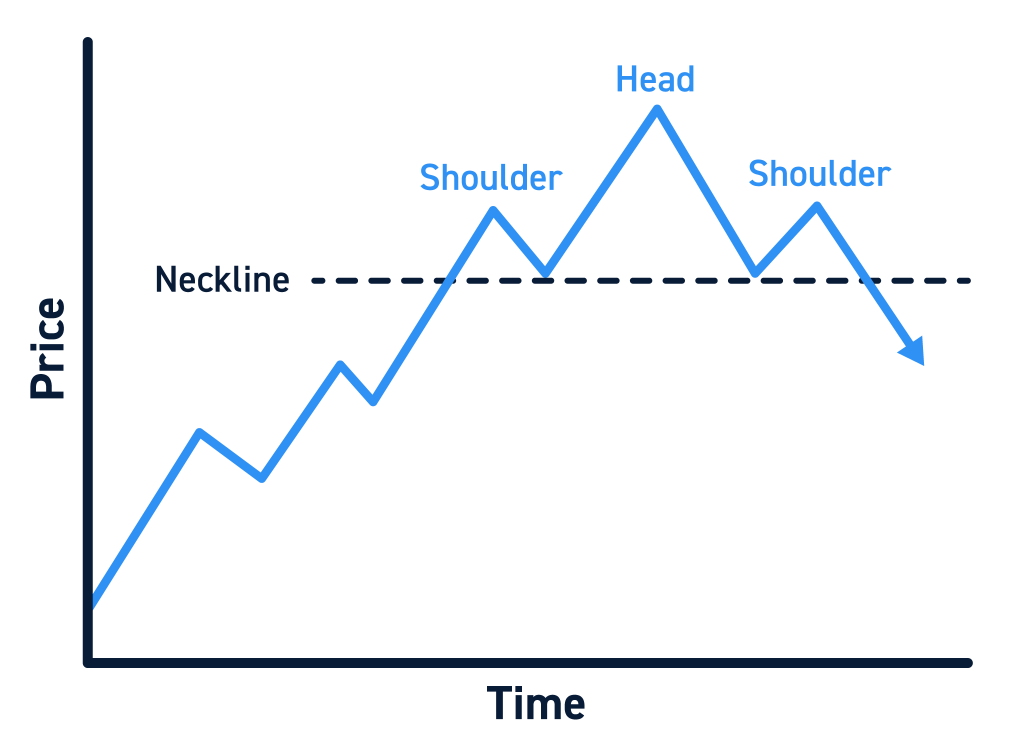
The Head and Shoulders pattern is one of the most reliable reversal patterns. It consists of three peaks: a higher middle peak (the head) flanked by two lower peaks (the shoulders).
How to Identify It
- Left Shoulder: The first peak, followed by a decline.
- Head: The highest peak, followed by another decline.
- Right Shoulder: The third peak, lower than the head but similar in height to the left shoulder.
- Neckline: A support line connecting the lows of the two troughs.
Trading the Pattern
When the price breaks below the neckline after forming the right shoulder, it’s a strong signal that the trend is reversing from bullish to bearish.
Double Top and Double Bottom Chart Pattern
Double Top
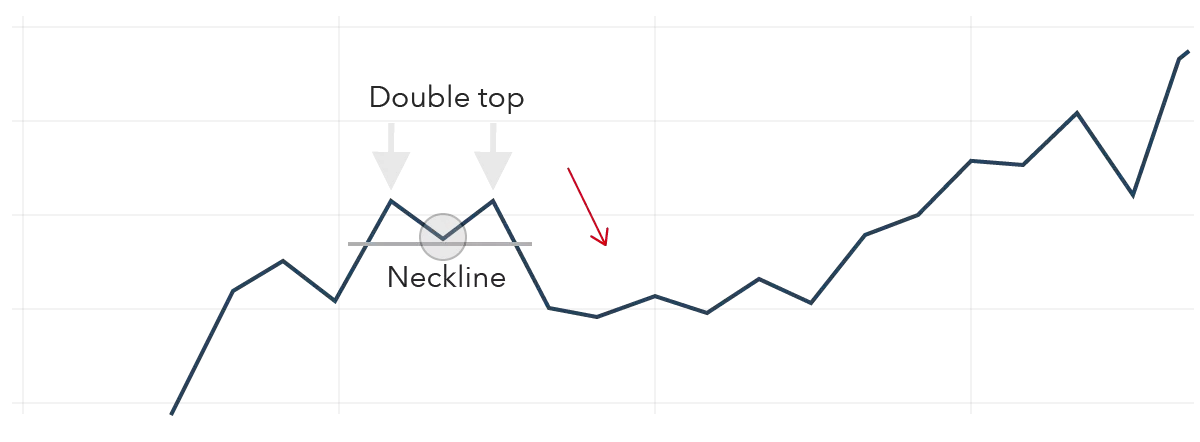
The Double Top pattern signals the end of an uptrend and the beginning of a downtrend. It forms when the price reaches a high point twice but fails to break through.
Double Bottom
Conversely, the Double Bottom pattern indicates the end of a downtrend and the start of an uptrend, forming when the price hits a low point twice without breaking below.
How to Trade
- Double Top: Enter a short position when the price breaks below the support level between the two tops.
- Double Bottom: Enter a long position when the price breaks above the resistance level between the two bottoms.
Rounding Top and Rounding Bottom Chart Pattern

Rounding Top
The Rounding Top pattern is a gradual reversal pattern, indicating a slow shift from bullish to bearish sentiment.
Rounding Bottom
The Rounding Bottom pattern signals a gradual change from bearish to bullish sentiment.
Trading the Pattern
- Rounding Top: Enter a short position when the price breaks below the key support level.
- Rounding Bottom: Enter a long position when the price breaks above the key resistance level.
Triple Top and Triple Bottom Chart Pattern
Triple Top
The Triple Top pattern is similar to the Double Top but consists of three peaks at the same resistance level, signaling a strong bearish reversal.
Triple Bottom
The Triple Bottom pattern has three troughs at the same support level, indicating a strong bullish reversal.
How to Trade
- Triple Top: Short the asset when the price breaks below the neckline after the third peak.
- Triple Bottom: Go long when the price breaks above the neckline after the third trough.
Falling and Rising Wedge Chart Pattern

Falling Wedge
The Falling Wedge pattern forms during a downtrend and signals a potential bullish reversal.
Rising Wedge
The Rising Wedge pattern forms during an uptrend and indicates a bearish reversal.
Trading the Pattern
- Falling Wedge: Enter a long position when the price breaks above the upper trendline.
- Rising Wedge: Enter a short position when the price breaks below the lower trendline.
Essential Technical Indicators for Trend Reversals
Moving Averages (MAs) Indicator
:max_bytes(150000):strip_icc()/MAchart-ab93514100854367b08fbbf5a1dd9a6f.jpg)
What Are Moving Averages?
Moving Averages are one of the most commonly used indicators to smooth out price data and identify trends.
Types of Moving Averages
- Simple Moving Average (SMA): The average price over a specific number of periods.
- Exponential Moving Average (EMA): Gives more weight to recent prices, making it more responsive to new information.
How to Use MAs for Trend Reversals
- Golden Cross: A bullish reversal signal when a short-term MA crosses above a long-term MA.
- Death Cross: A bearish reversal signal when a short-term MA crosses below a long-term MA.
Bollinger Bands
:max_bytes(150000):strip_icc()/dotdash_Final_Using_Bollinger_Bands_to_Gauge_Trends_Oct_2020-01-73f4b5749a6e445585bc2751d6e39d34.jpg)
What Are Bollinger Bands?
Bollinger Bands consist of a middle SMA line and two outer bands that represent standard deviations above and below the middle line.
Using Bollinger Bands for Reversals
- Bollinger Squeeze: Narrowing bands indicate low volatility and a potential significant price movement.
- Price Touching Bands: When the price touches the upper band, it might indicate an overbought condition (potential bearish reversal). Conversely, touching the lower band may indicate an oversold condition (potential bullish reversal).
MACD Indicator
What Is MACD?
The Moving Average Convergence Divergence (MACD) is a momentum oscillator that shows the relationship between two moving averages of a security’s price.
Key Components
- MACD Line: The difference between the 12-period and 26-period EMAs.
- Signal Line: A 9-period EMA of the MACD line.
- Histogram: The difference between the MACD line and the signal line.
How to Use MACD for Reversals
- MACD Crossovers: When the MACD line crosses above the signal line, it indicates a bullish reversal. Conversely, a cross below the signal line suggests a bearish reversal.
- Divergences: When the price makes a new high or low that isn’t confirmed by the MACD, it signals a potential reversal.
RSI Indicator
What Is RSI?
The Relative Strength Index (RSI) is a momentum oscillator that measures the speed and change of price movements.
RSI Levels
- Overbought: RSI above 70 suggests the asset is overbought (potential bearish reversal).
- Oversold: RSI below 30 indicates the asset is oversold (potential bullish reversal).
Using RSI for Reversals
- Divergences: Similar to MACD, RSI divergences occur when the price moves in the opposite direction of the RSI, signaling a potential trend reversal.
- Overbought/Oversold Conditions: Monitor these levels for potential reversal signals.
Integrating Multiple Signals for Accurate Reversal Identification
Combining Patterns and Indicators
Using multiple signals from different patterns and indicators increases the accuracy of identifying trend reversals. For example, a Head and Shoulders pattern confirmed by a bearish MACD crossover and RSI divergence is a stronger signal.
Importance of Confirmation
Always seek confirmation from multiple sources before making a trade. This reduces the likelihood of false signals and increases the probability of successful trades.
Practical Tips for Effective Trend Reversal Trading
Continuous Learning and Adaptation
Markets are dynamic and ever-changing. Continuously refine and adapt your strategies based on market conditions and new information.
Risk Management
Implementing robust risk management techniques is crucial. Use stop-loss orders, position sizing, and risk-reward ratios to manage potential losses.
Keeping an Eye on Market Sentiment
Stay informed about market news and sentiment, as these can significantly impact trend reversals. For instance, economic reports, geopolitical events, and market psychology often play pivotal roles in reversing trends.
Case Studies and Real-World Examples
Successful Trades Using Trend Reversal Signals
Share examples from personal trading experiences where trend reversal signals led to successful trades. Detail the patterns or indicators used and the outcomes of these trades.
Learning from Mistakes
Discuss trades where misinterpreting trend reversal signals resulted in losses. Highlight the lessons learned and how these experiences improved future trading strategies.
Conclusion
Mastering trend reversal signals is a powerful skill for any trader. By understanding and effectively utilizing chart patterns and technical indicators, you can make more informed trading decisions. Remember, the key to successful trading lies in continuous learning, disciplined risk management, and adapting strategies to ever-changing market conditions. Embrace the journey, and may your trades be ever profitable!